


De De Pyaar De 2 1 - 14 Days Box Office Collection (India)
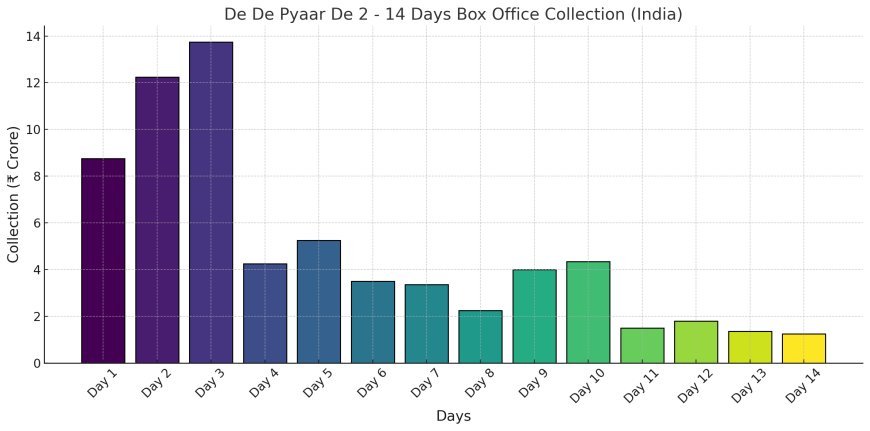
Explore the 14-day box office collection trend of De De Pyaar De 2 in India! This dynamic chart highlights the film’s performance, from its opening weekend to its second week. The gradient colors, transitioning from green (growth) to yellow (moderate change) to red (decline), give a clear visual representation of how the collections fluctuated over the two-week period. Stay updated on the film’s financial success and track the highs and lows of its journey at the box office.

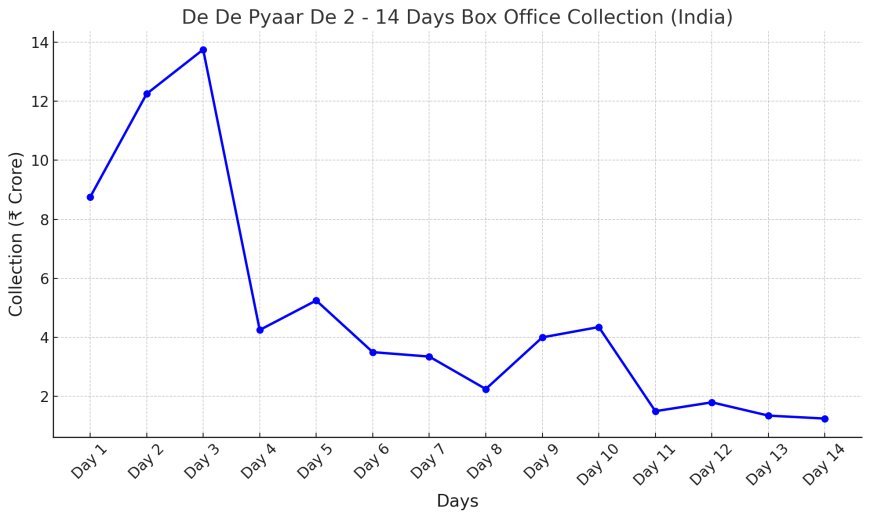

De De Pyaar De 2 1 - 14 Days Box Office Collection (India)
| Day | Collection (₹ Crore) | Change vs Previous Day (%) |
|---|---|---|
| Day 1 (Fri) | 8.75 | — |
| Day 2 (Sat) | 12.25 | +40.00% |
| Day 3 (Sun) | 13.75 | +12.24% |
| Day 4 (Mon) | 4.25 | –69.09% |
| Day 5 (Tue) | 5.25 | +23.53% |
| Day 6 (Wed) | 3.50 | –33.33% |
| Day 7 (Thu) | 3.35 | –4.29% |
| Week 1 Total | 51.10 | — |
| Day 8 (2nd Fri) | 2.25 | –32.84% |
| Day 9 (Sat) | 4.00 | +77.78% |
| Day 10 (Sun) | 4.35 | +8.75% |
| Day 11 (Mon) | 1.50 | –65.52% |
| Day 12 (Tue) | 1.80 | +20.00% |
| Day 13 (Wed) | 1.35 | –25.00% |
| Day 14 (Thu) | 1.25* | — |
| Total (14 days) | 67.60 | — |
Files
What's Your Reaction?


Dk01
"Welcome to Village Guider! Your ultimate destination for the latest in entertainment. From movie reviews and celebrity gossip to TV show updates and pop culture trends, we bring you all the entertainment news you crave. Stay informed and entertained with fresh content every day!"
Entertainment news
Celebrity gossip
Movies and TV shows
Trending entertainment
Movie reviews
Celebrity news
TV show updates
Pop culture
Entertainment trends
Celebrity interviews
Film reviews
TV series news
Latest entertainment
Upcoming movies
Celebrity lifestyle
Entertainment blog
Showbiz updates
Entertainment buzz
Pop culture updates
Entertainment gossip